Forex complex trading strategies are those that include more than three technical indicators for generating signals and have a number of important rules to use as a complex technique in trading.
Attention all users: trading strategies are posted for their educational purpose only. Trading rules may be subject to interpretation. Risk levels may be increased dramatically under extreme market conditions. Use and/or modify the ideas to create your trading style/system, but only at your own risk. We strongly recommend testing strategies on demo accounts before investing money.
Again those strategies will be free and will have illustrations, examples, analysis and recommended trading set-ups.
This should be a good strategic base for every trader to explore something new and improve own trading systems and techniques.
The fact is, complex strategies sometimes get unnecessary complex. But even then it will not stop most of the traders from testing and applying them in Forex trading. Here we have a new level of strategy making: you can either simplify the system you like, adopt its rules completely and trade happily or
just make some useful notes for yourself and move on.
Stay tuned!
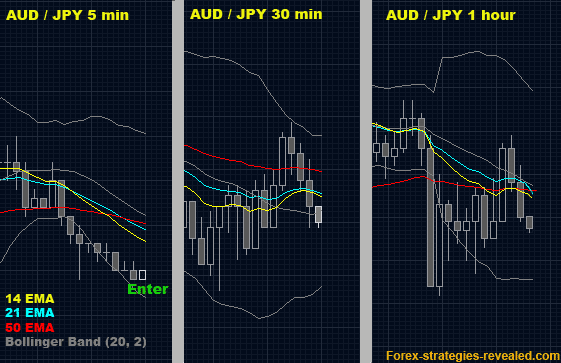
Complex trading system #1 ("Multi-conditional")
Currency: ANY
Time frame: 1 hour + 30 min + 5 min.
Indicators: 14 EMA, 21 EMA, 50 EMA, Bollinger Band (20, 2).
Entry rules: Enter on 5 minutes chart.
On 5 minutes chart, for uptrend:
if 14 EMA is above 21 EMA,
then if both 14 EMA and 21 EMA are above 50 EMA,
then if 50 EMA is within the Bollinger Bands borders,
then...
go and check 30 min chart:
if price bar is a up-close bar and sitting on 14 EMA or 21 EMA
and same again:
if 14 EMA is above 21 EMA,
then if both 14 EMA and 21 EMA are above 50 EMA,
then if 50 EMA is within the Bollinger Bands borders,
then...
go Long...
OR go and check if 1 hour chart meet same conditions as for 30 min chart and then go Long.
If at least one condition is violated – stay away.
The reverse is for the downtrend:
Enter on 5 minutes chart.
On 5 minutes chart, for downtrend:
if 14 EMA is below 21 EMA,
then if both 14 EMA and 21 EMA are below 50 EMA,
then if 50 EMA is within the Bollinger Bands borders,
then...
go and check 30 min chart:
if price bar is a down-close bar and touching 14 EMA or 21 EMA
and same again:
if 14 EMA is below 21 EMA,
then if both 14 EMA and 21 EMA are below 50 EMA,
then if 50 EMA is within the Bollinger Bands borders,
then...
go Short... or go and check same rules for 1 hour chart and only then enter Short on 5 minutes chart.
Exit rules: exit when any of the conditions is violated or when the profit is high enough to close the trade.
Complex trading system #2 (“2-Cross”)
Currency: GBP/USD (preferred) or any other.
Time frame: 3 hours (preferred) or 4 hours.
Indicators:
SMA 200, SMA 100 – these are two influential SMAs; you will find price “obeying” their boundaries.
SMA 15
EMA 5
MACD (12, 26, 9)
Trading Rules:
Since we are dealing with “unpredictable until set” indicators (EMA, SMA, MACD) we will always be using signals AFTER the current signaling candle is closed.
1. Never open a trade if price is less than 25 pips away from 100 SMA or 200 SMA.
2. Do enter the market when price has crossed either 100 SMA (expect large move) or 200 SMA (expect very large move) and only after the current candle has closed on the opposite side of the SMA. SMAs this big do not get crossed very often.
3. Set stop loss initially at 50 pips. Look for nearest support/resistance level and adjust it accordingly – it could grow up to 70-90 pips but it should not be less than 40 pips. Anyway this measure is taken only to save us from sudden “exploding market”, in all other cases it will not be hit as our system will take you earlier from the trade.
4. Enter in the direction of 5 EMA once two conditions are met:
1) 5 EMA crosses 15 SMA “permanently” – which means the current candle is closed and lines are “locked” and will not move misleading us.
2) MACD lines are crossed, and the current candle is closed.
The 2 crosses do not have to happen simultaneously. MACD lines can cross earlier than EMA and SMA or shortly after, but there should be no more than 5 candles in between 2 crosses.
If “2-cross” condition is not met – no entry.
Exit rules: exit with the same rules as for entry: when two crosses are in place. If we have only one cross – we are still in trade.
Profit target:
a) can be set to a desired amount of pips and followed with trailing stop further once the target is reached.
b) or use 50 pips profit target – do start chasing the price with trailing stop after gaining 50 pips.
c) or you may not use trailing stop and set no profit targets, then exit according to Exit rules – on the next “2-cross”.
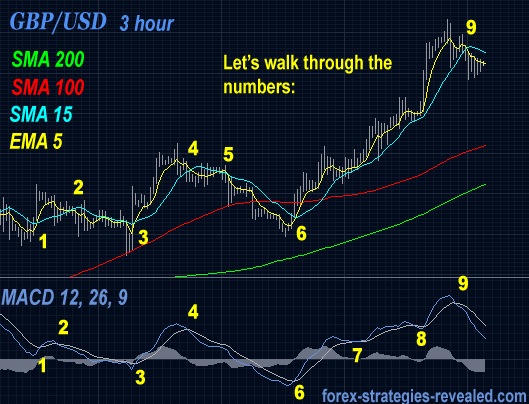
Let’s walk through the numbers:
#1 – EMA 5 crosses 15 SMA, MACD lines also crossed, price is not close to SMA 100 – we place Long order.
#2 – again we have 2 crosses: moving averages cross and MACD – we exit Long and immediately place Short order.
# 3 – 2 crosses are in place, by the time our current signaling candle is closed we are already far enough from 100 SMA, so we close Short and open Long position.
Yes, till this point we were trading in sideways moving market – so no profits here, may be some small negative results. Solution – trading only during active hours, for GBP/USD it is London and New York sessions.
#4 – As we were Long – this point is our exit (“2-cross” condition is met again)
and immediately place Sell order.
#5 – moving averages on the chart have crossed, however MACD – does not, we stay in trade.
We watch price passing 100 SMA and closing below it – it is a good sell signal, but we are already trading it.
#6 – first appears MACD crossover, followed by moving averages crossover – at this point we close our Short position. Do we open Long position immediately? No, because we are very close to 100 SMA. We need to wait until candle passes and closes above 100 SMA to open a Long trade. Once it happens we are in trading Long.
#7 – MACD lines has attempted to cross, but nothing to worry as there is no second cross from moving averages.
#8 – same as #7.
#9 – time to finally close Long position and go Short.
Best of luck in your Forex trading!
Complex trading system #3 (Divergence)
Currency: EUR/USD (preferred) or any other.
Time frame: 30 min.
Indicators: MACD (5, 26, 1) – draw 0 line,
Full Stochastic (14, 3, 3)
EMA 3
SMA 13
Trading rules: watch for divergence between the price on the chart and MACD or between price on the chart and Stochastic.
Once divergence spotted, wait for EMA 3 and SMA 13 to cross and enter the trade in the direction of EMA 3.
Set stop loss at 26 pips.
Take half of the profit at 20 pips; let the rest to run further with trailing stop in place.

Divergence on Stochastic can be found the same way as on MACD. The reason for using both MACD and Stochastic is that one of the indicators can show divergence while the other will not at given period of time.
http://forex-strategies-revealed.com/
Complex trading system #4 (Trend trading with EMAs)
Trading strategy setup:
Time frame: 1 day, 1 hour or 30 min.
Currency pair: any.
Indicators:
80 EMA
21 EMA
13 EMA
5 EMA
3 EMA
RSI (21)
Trading rules:
80 EMA suggests a major trend direction.
When the price is traded above 80 EMA – uptrend, opposite for downtrend.
21 EMA and 13 EMA give a current trend direction.
While 13 EMA stays above 21 EMA – uptrend, opposite for downtrend.
RSI (21) above 50 mark suggests an uptrend, below – downtrend.
Entries are made on a cross of 3 and 5 EMA in the direction of a trend:
Buy when 3 EMA crosses 5 EMA upward in an uptrend market AND both 3 and 5 EMA cross a channel of 13 and 21 EMA AND RSI is above 50.
Entry with Sell order when 3 EMA crosses 5 EMA downward in a downtrend market AND both 3 and 5 EMA cross the 13 and 21 EMA AND RSI is below 50.
Note that additional entries are possible when 3 and 5 EMA cross back and then shortly after make a signalling cross again.
Note, that when we get the signal to enter we always wait for the current price bar to close and only then (if conditions nave not changed) - open a position.
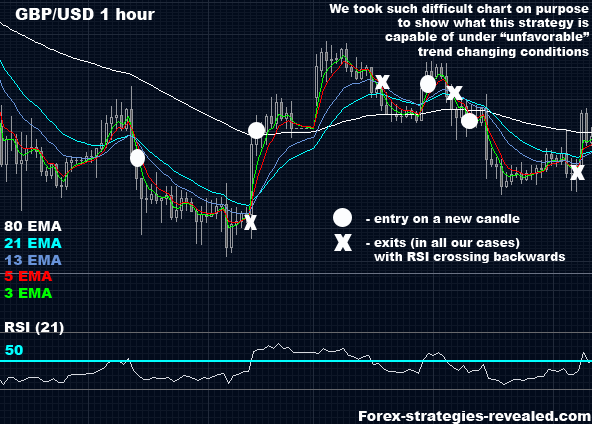
Exit rules: when 13 EMA crosses 21 EMA back.
Keep an eye on 80 EMA, also watch RSI 21 to cross 50 point mark again - both will suggest immediate exits.
P.S. For more conservative trading take positions that do not contradict with 80 EMA's trend suggestion.
Happy Forex trading!
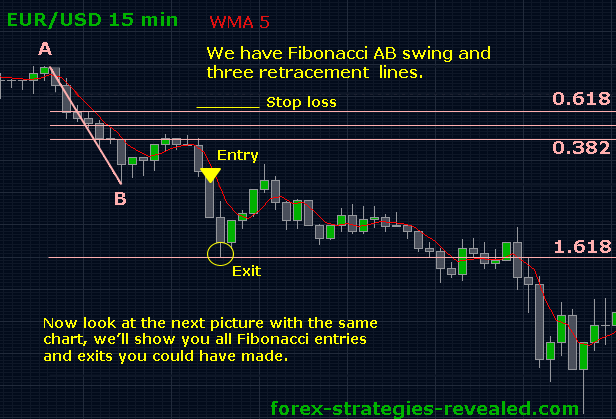
Complex trading system #5 (Fibonacci trading)
We were asked to post some strategies that will work on smaller time frames.
Here is one very nice trading system that can be worth your attention.
When a trader chooses to use small time frames (like 10 min, 15 min, 30 min even 1 hour) risks to be wrong are always higher than with larger time frames.
Therefore, it is very important to have a really good Forex trading system that can advise on entries with high chances to win and what's more important it should be able to tell exactly where to exit without need to constantly monitor the price.
Note also, the more traders look at charts, the more they tend to have controversial feelings about the success of a current open trade...
With all this long introduction, it is only left to mention that this strategy will require from traders basic knowledge of use of Fibonacci tool.
What is Fibonacci tool and how to use it? Simply Google "forex fibonacci" phrase and you'll find a lot of information about it.
...This is probably the only reason we classified this trading system as Complex one, not every trader is comfortable with using Fibonacci studies in Forex.
Trading setup:
Time frame: any over 5 min and less than 3 hour.
Currency pairs: any.
Indicators: 5 WMA
Rules:
Look at the price waves. Find the most recent swing high and the most recent swing low = so called Fibonacci A swing and B swing.
Pull Fibonacci from A to B.
To know which direction to pull (up or down) simply look at the trend; if it is unclear, find appropriate AB swings and set Fibonacci in both directions.
Once set, wait and watch the retracement from AB swing to unfold.
During the retracement there are three conditions to be met in order to consider trading:
1. The price must touch 5 WMA.
2. The price must at least touch 0.382 Fibonacci retracement level.
3. The 0.618 Fibonacci retracement level must not fail. Here it means the price should not close below (uptrend) / above (downtrend) 0.618 retracement line. It can touch or poke it, but the level must withstand the "attack".
When all three criteria are met, enter once the candle is clearly closed above 5 WMA for Long entry, below - for Short.
Stop order is placed always 4-5 pips above (downtrend) / below (uptrend) the 0.618 Fibonacci retracement level.
Profit target is set to 1.618 Fibonacci expansion level derived from point A.
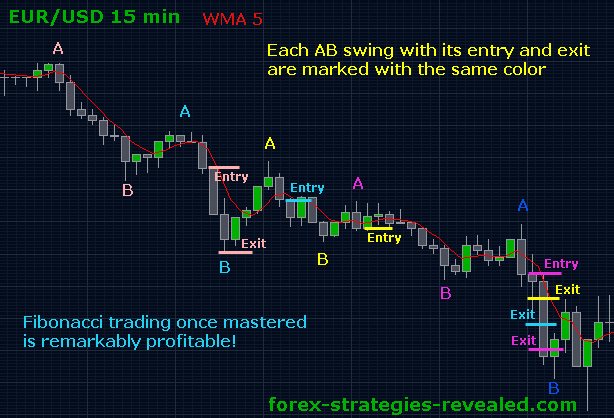
Master your Fibonacci trading!
Complex trading system #6 (Munzer Forex System)
Munzer - South Lebanon submitted own Forex system:
"Hello
I am using this strategy and it works well with me
I like to share it with others
This website is the best I have got use off
Mine is on 1 hour chart:
Two EMA of settings 5 and 15 - close
Two EMA of settings 144 and 169 - close- vegas 1 hour tunnel
asctrend2 for determining stop
MACD settings 12,26,9
RSI settings 21
Trend trigger mod
Entry long:
EMA 5 and 15 crossover upward
crossover of MACD lines upward
RSI(21) > 50
and TrendTriggerMod upward
Short entry:
EMA 5 and 15 crossover downward
crossover of MACD lines downward
RSI(21) <>
Hint1: do not make the trade if trendtriggermod do not agree the others
Hint2: beware of the 2 EMA's 144 and 169 They work well as Support and
Resistance
Exit: Use new crossover of MACD lines
Stop loss depends on asctrend2 or use ATR(14)*2"
Thank you! Well done!
(Forex Strategies Team http://forex-strategies-revealed.com/
Complex trading system #7 (Mohammed Munzer Forex system) more to come...
Current Forex system was submitted by Mohammed Munzer - our valued contributor.
hello all
timeframe: daily
EMA(34)
SMA(150)
Double CCI (CCI=50 and CCI=14)
Full stochastics (5,3,3)
- When price is between EMA(34) and SMA(150) Do not trade
- Trade long when EMA(34) is over SMA(150) and a daily candle crosses
EMA(34) and closes over it by putting an entry order 10 pips above the
candle's high taking into consideration that stochastics lines are up and
not in the overbought zone
- trade short when EMA(34) is below SMA(150) and a daily candle crosses
EMA(34) and closes below it by putting entry order 10 pips below the
candle's low taking into consideration that stochastics lines are down and
not in oversold zone
- Exit depends on stochastics lines crosses
Stop loss= 75% Daily ATR
- You can repeat entrys after retracements towards EMA(34) or towards "NO
TRADE ZONE" depending on double CCI patterns trend continuation and trend
line break only if stochastics and entry conditions returns valid -closing
above EMA(34) for long or below it for short and with entry orders 10 pips
above for long and below for short.
Thank you once again!
Forex Strategies Team http://forex-strategies-revealed.com/

No comments:
Post a Comment